Marisco is a portfolio tracker that makes you smarter. Connect your banks, brokers and exchanges to see what you own, earn, spend and save in one place, in your own currency. Ask questions about your own numbers, understand how it all fits together, and learn to make more informed decisions.
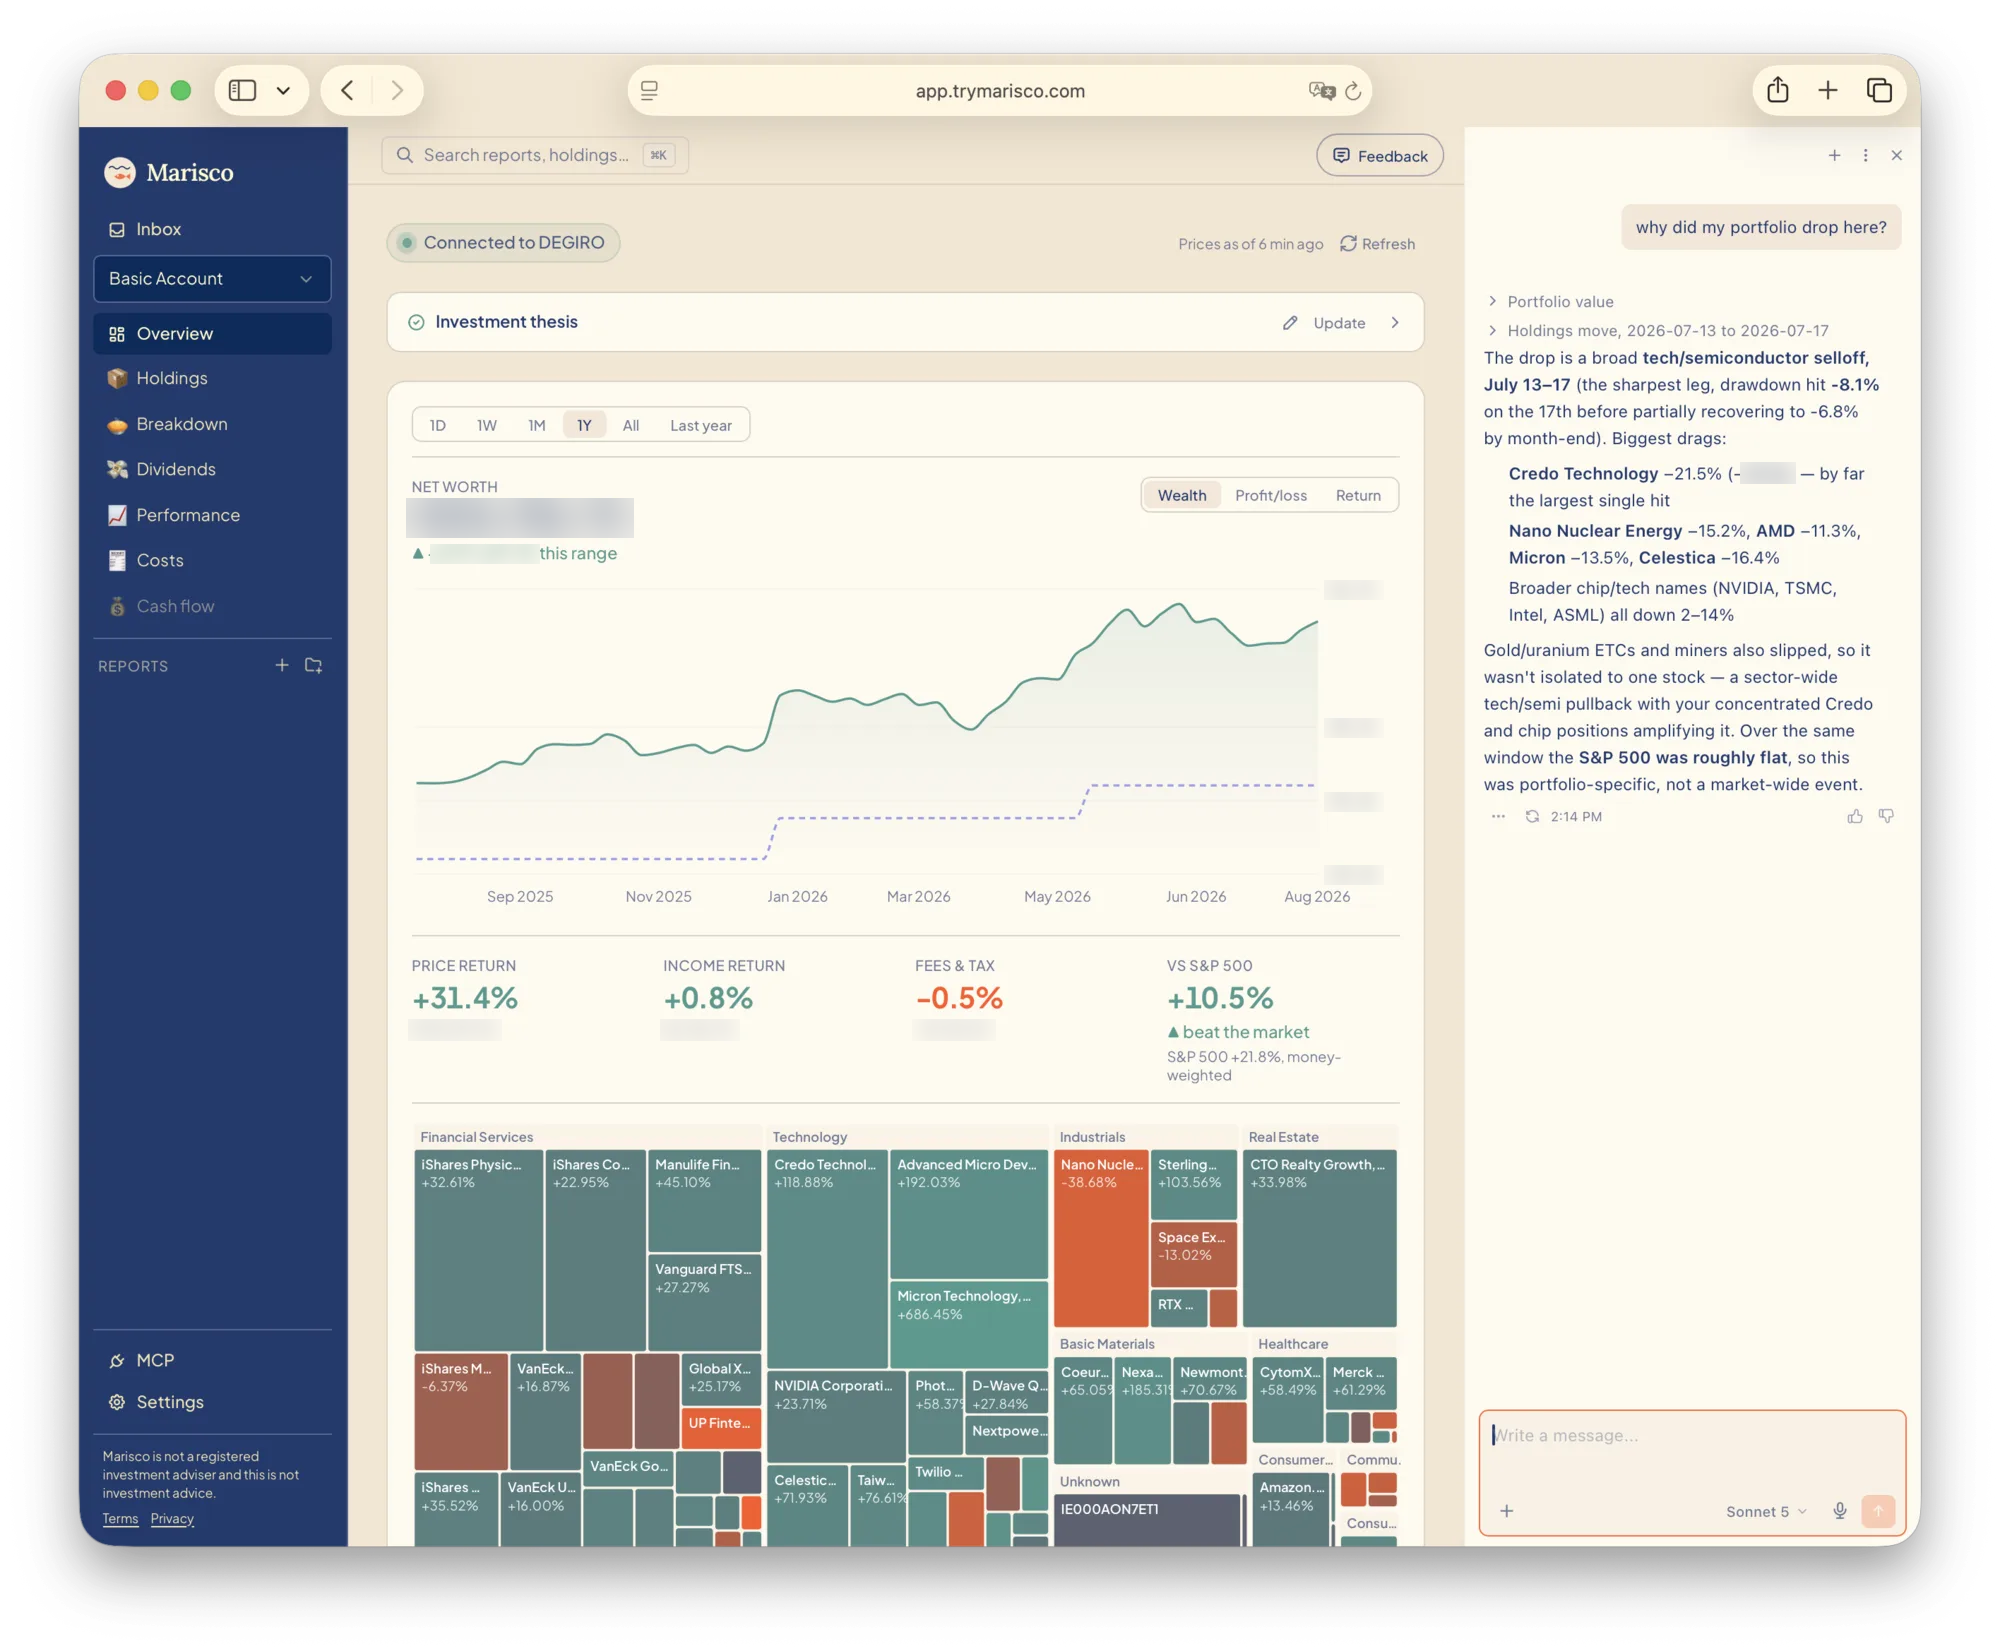
Your wealth, aggregated.
See your investments, cash, cars, real estate... all together.
The whole picture
See your wealth and how it changes.
All your accounts, together
Bring banks, brokers and other assets into view.
Go beyond the balance
Ask questions and get to know your numbers.
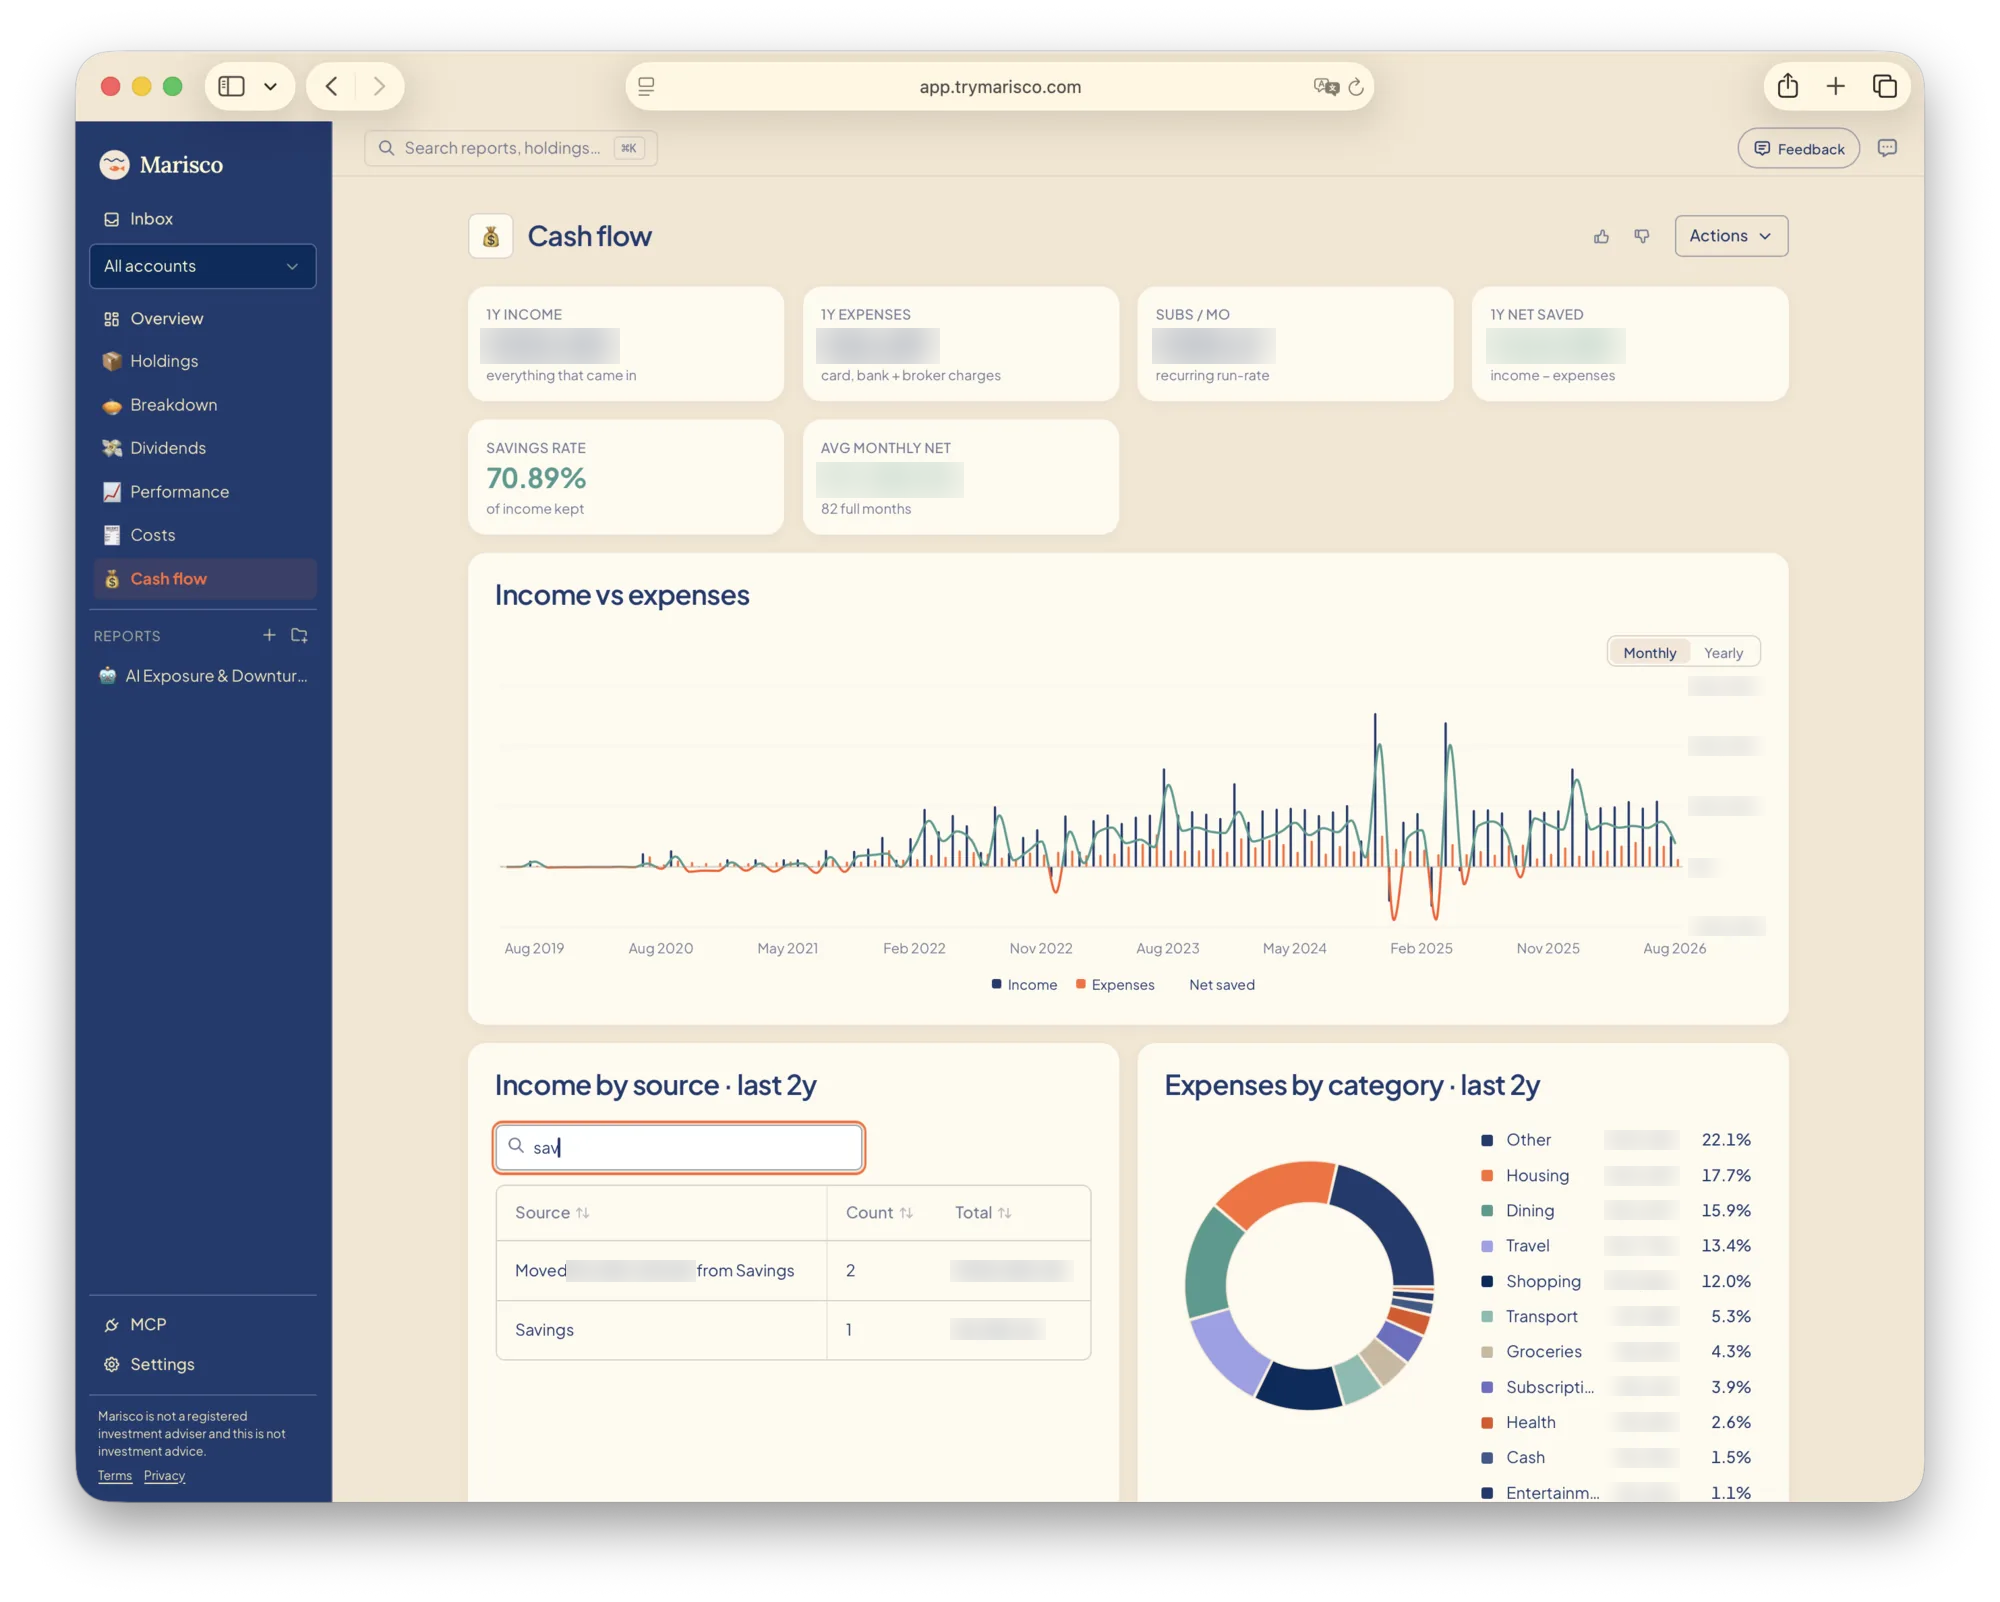
Understand where it goes.
Make sense of your spending, subscriptions and what you keep each month.
Follow the money
See income and spending over time.
Make sense of your habits
Break down expenses by category and account.
See what stays
Understand how much you keep each month.
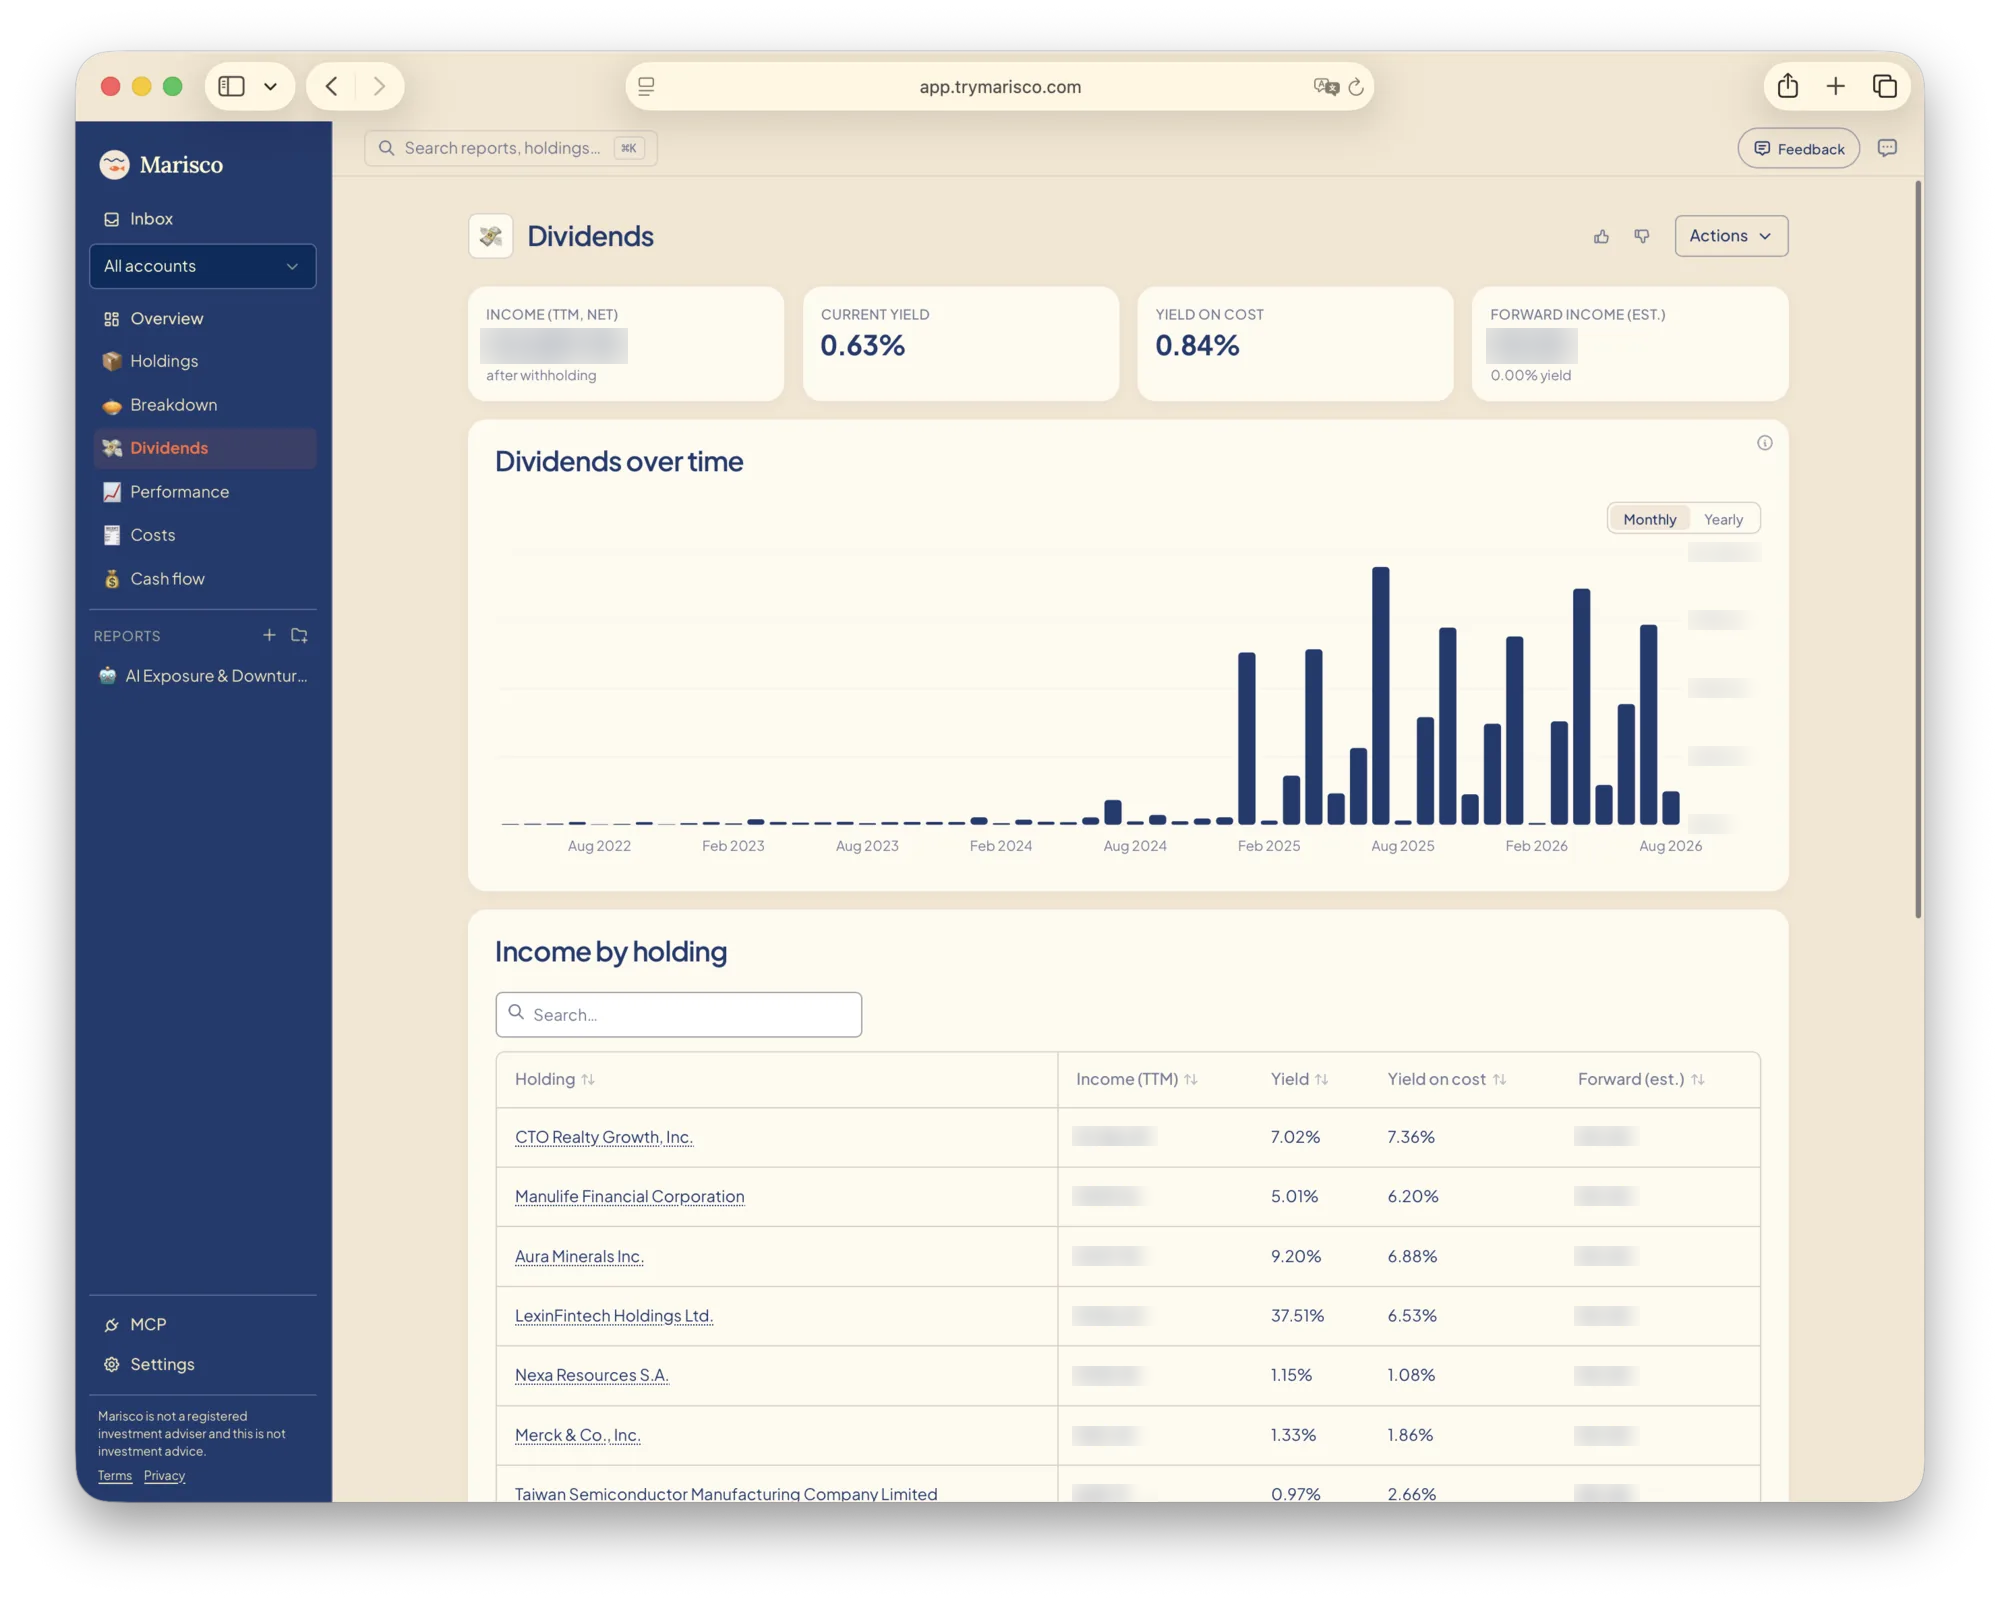
See what your money earns.
Follow the dividends and income your investments bring in.
Clear visual breakdowns
See your investment income over time.
By holding, by account
Understand where your dividends come from.
Look ahead
Explore estimated income from your holdings.
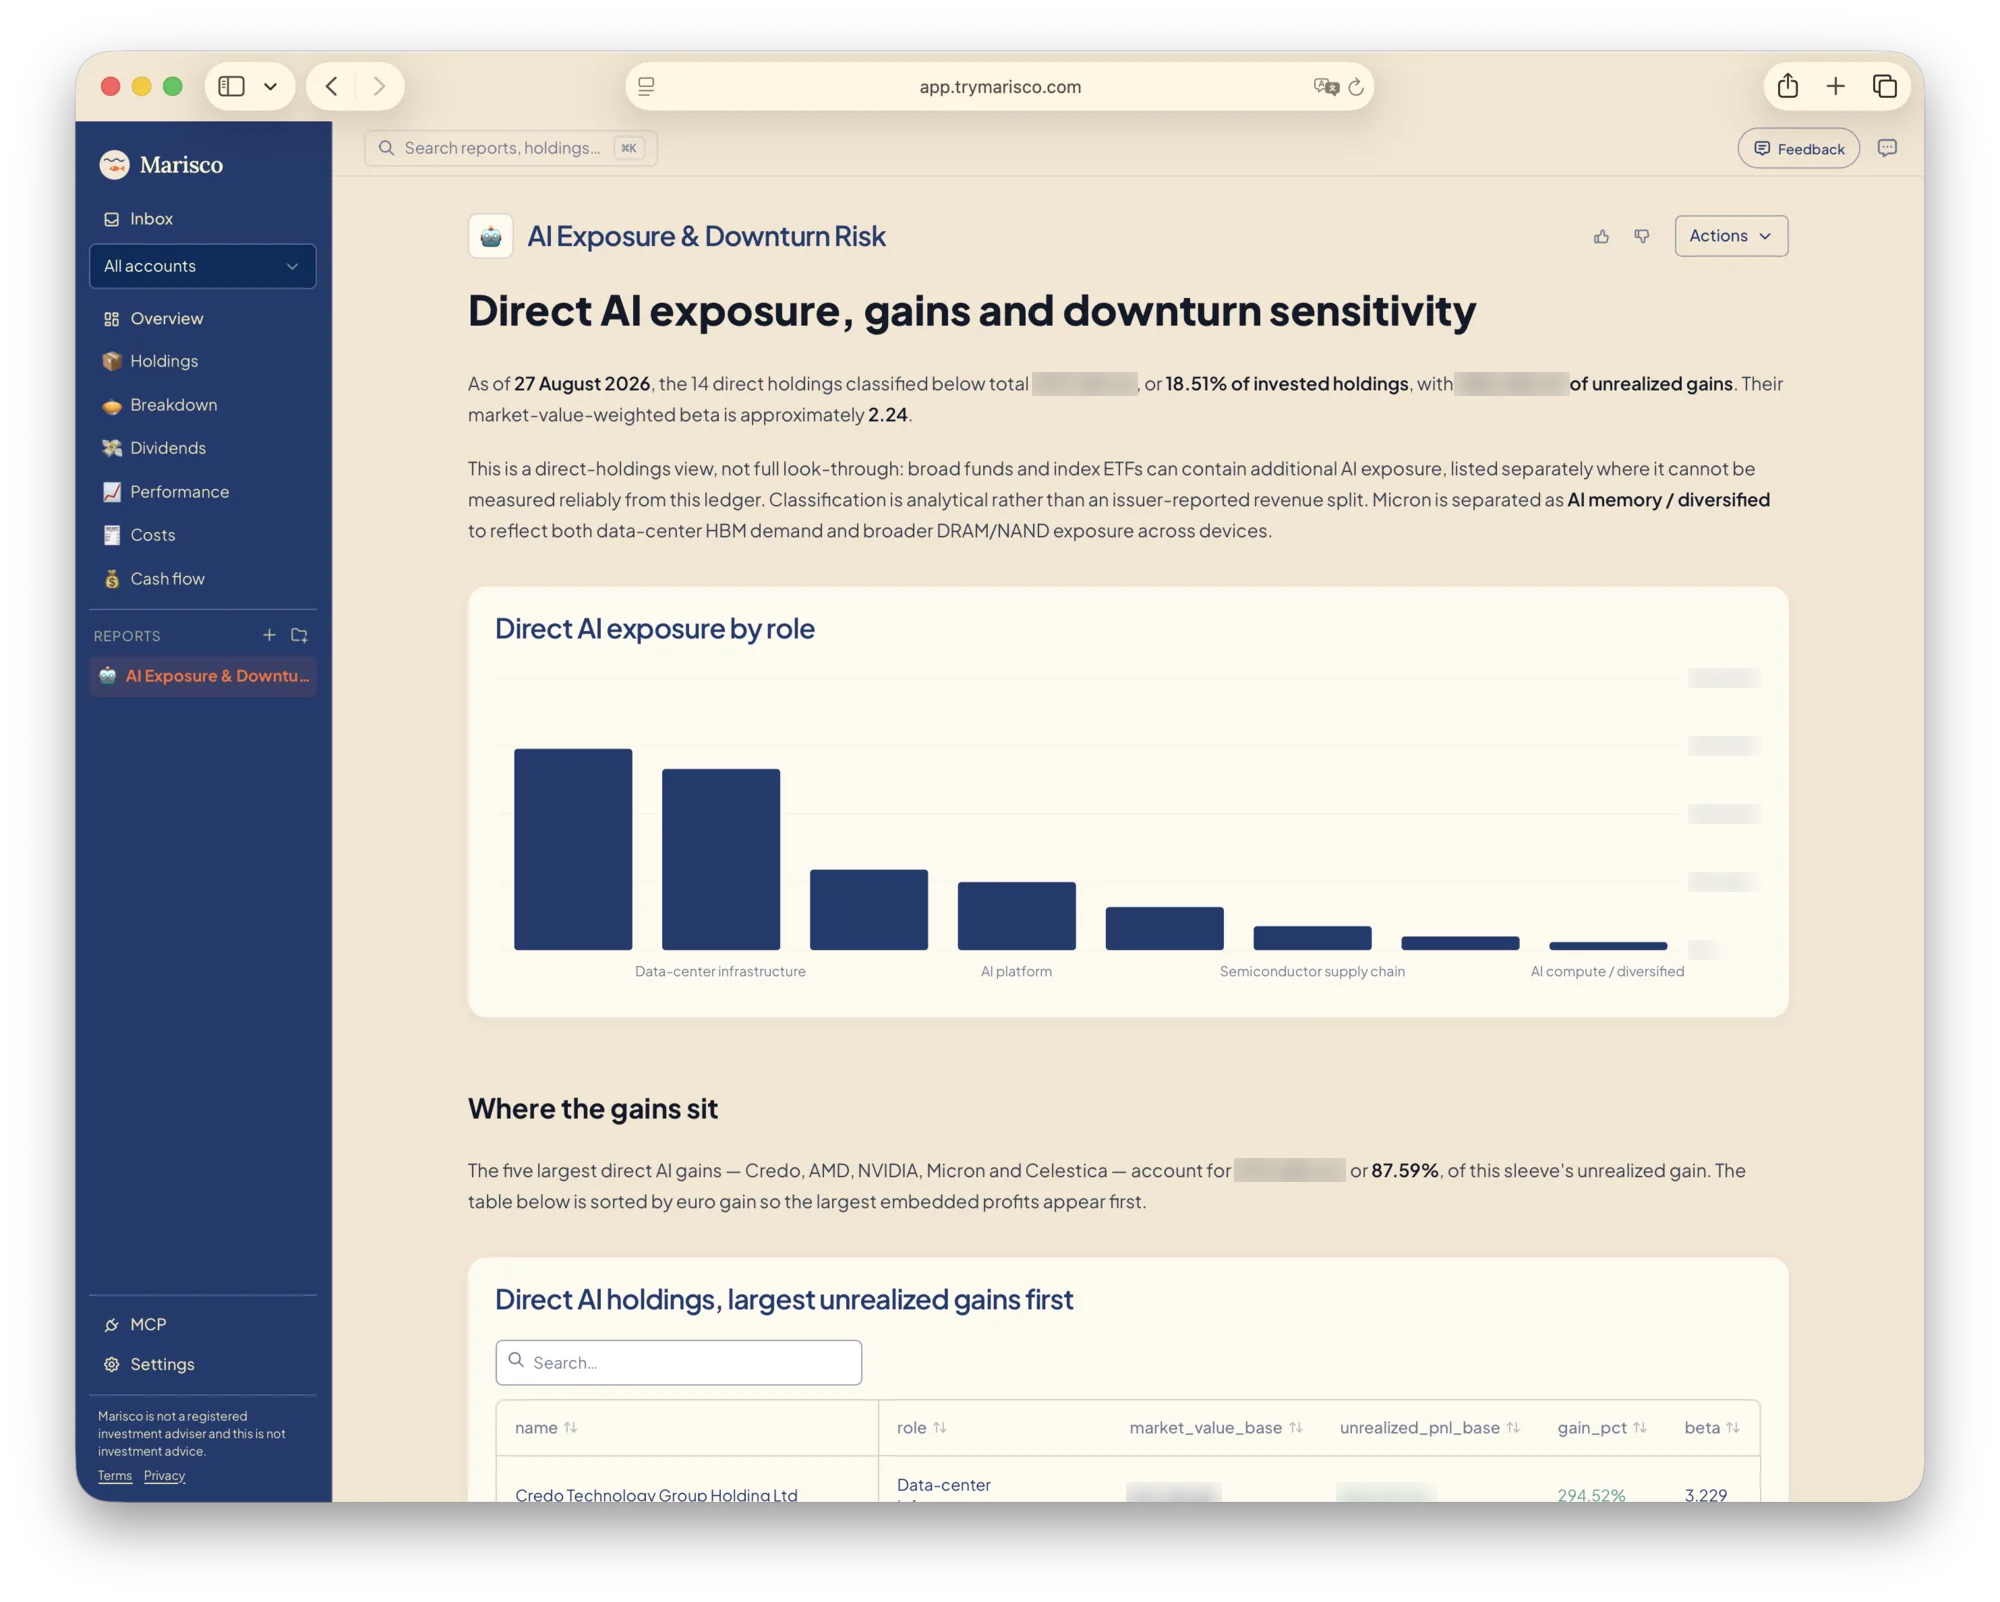
Reports you come back to.
Save what you learn as a report, and pick it up again whenever you like.
Your questions, made visual
Turn an analysis into charts and comparisons.
Keep what matters
Save useful findings together in a report.
Pick up where you left off
Return to your reports as your portfolio changes.
Stay in the loop.
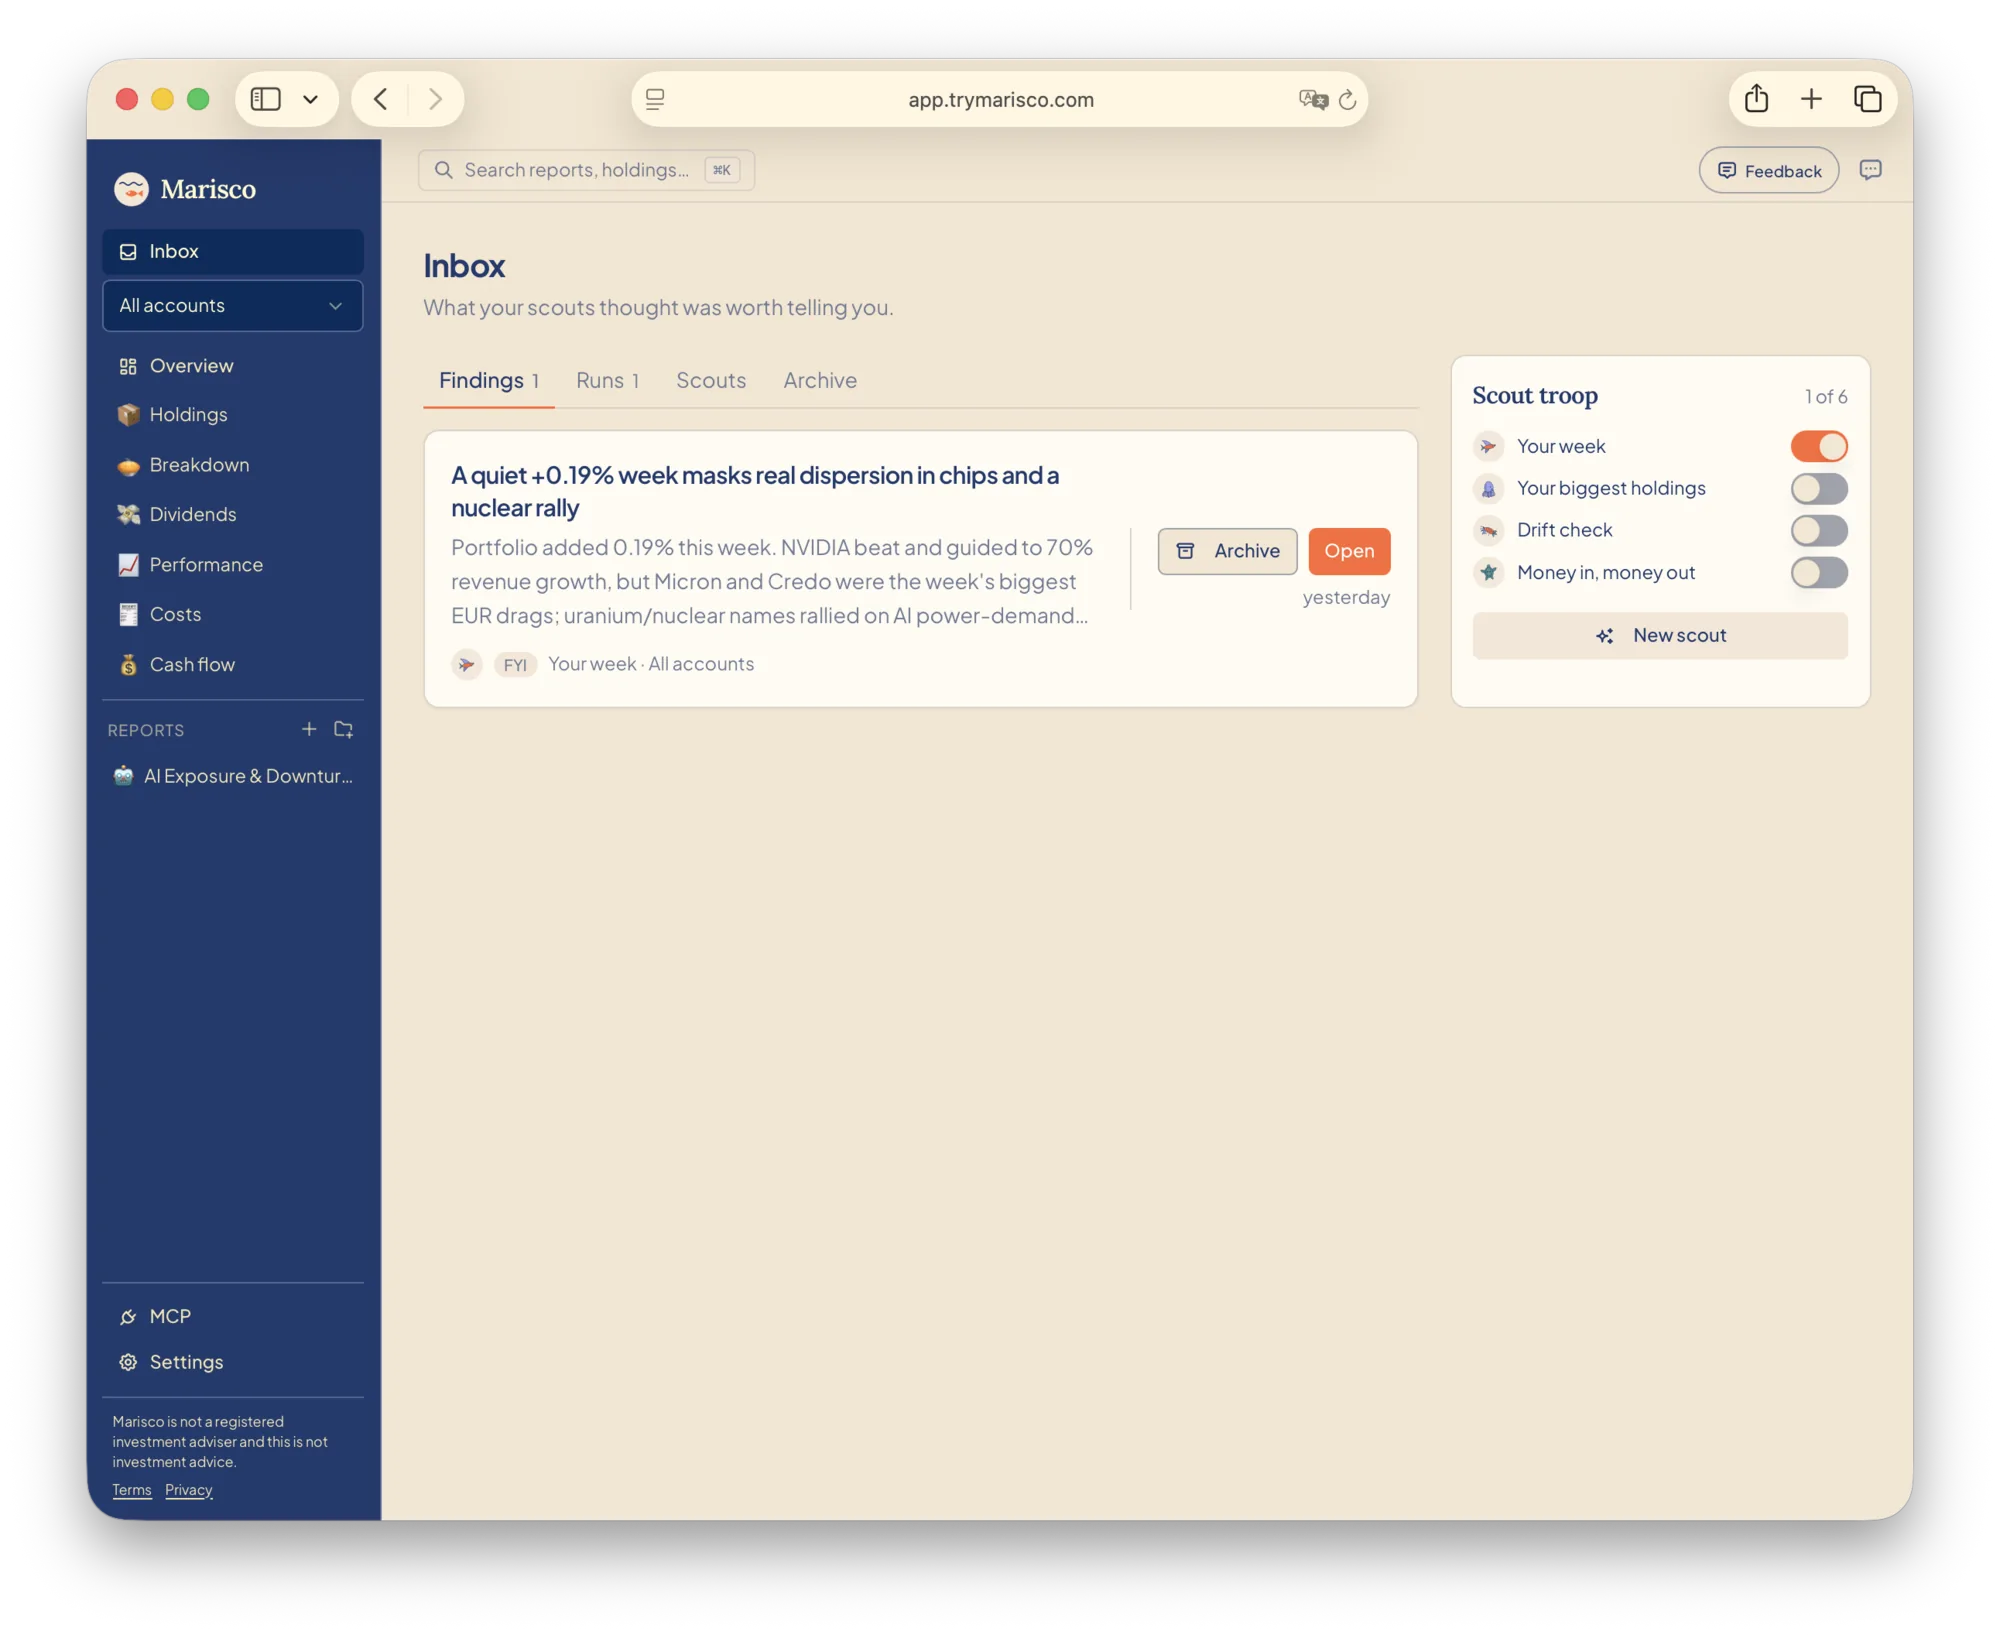
Let scouts bring you updates about the things that matter to you. Automatically.
Follow what interests you
Keep an eye on companies, themes and markets.
Updates with context
Understand why a finding might matter to you.
Stay curious, automatically
Let scouts bring new findings to your inbox.
Keep the details in view.
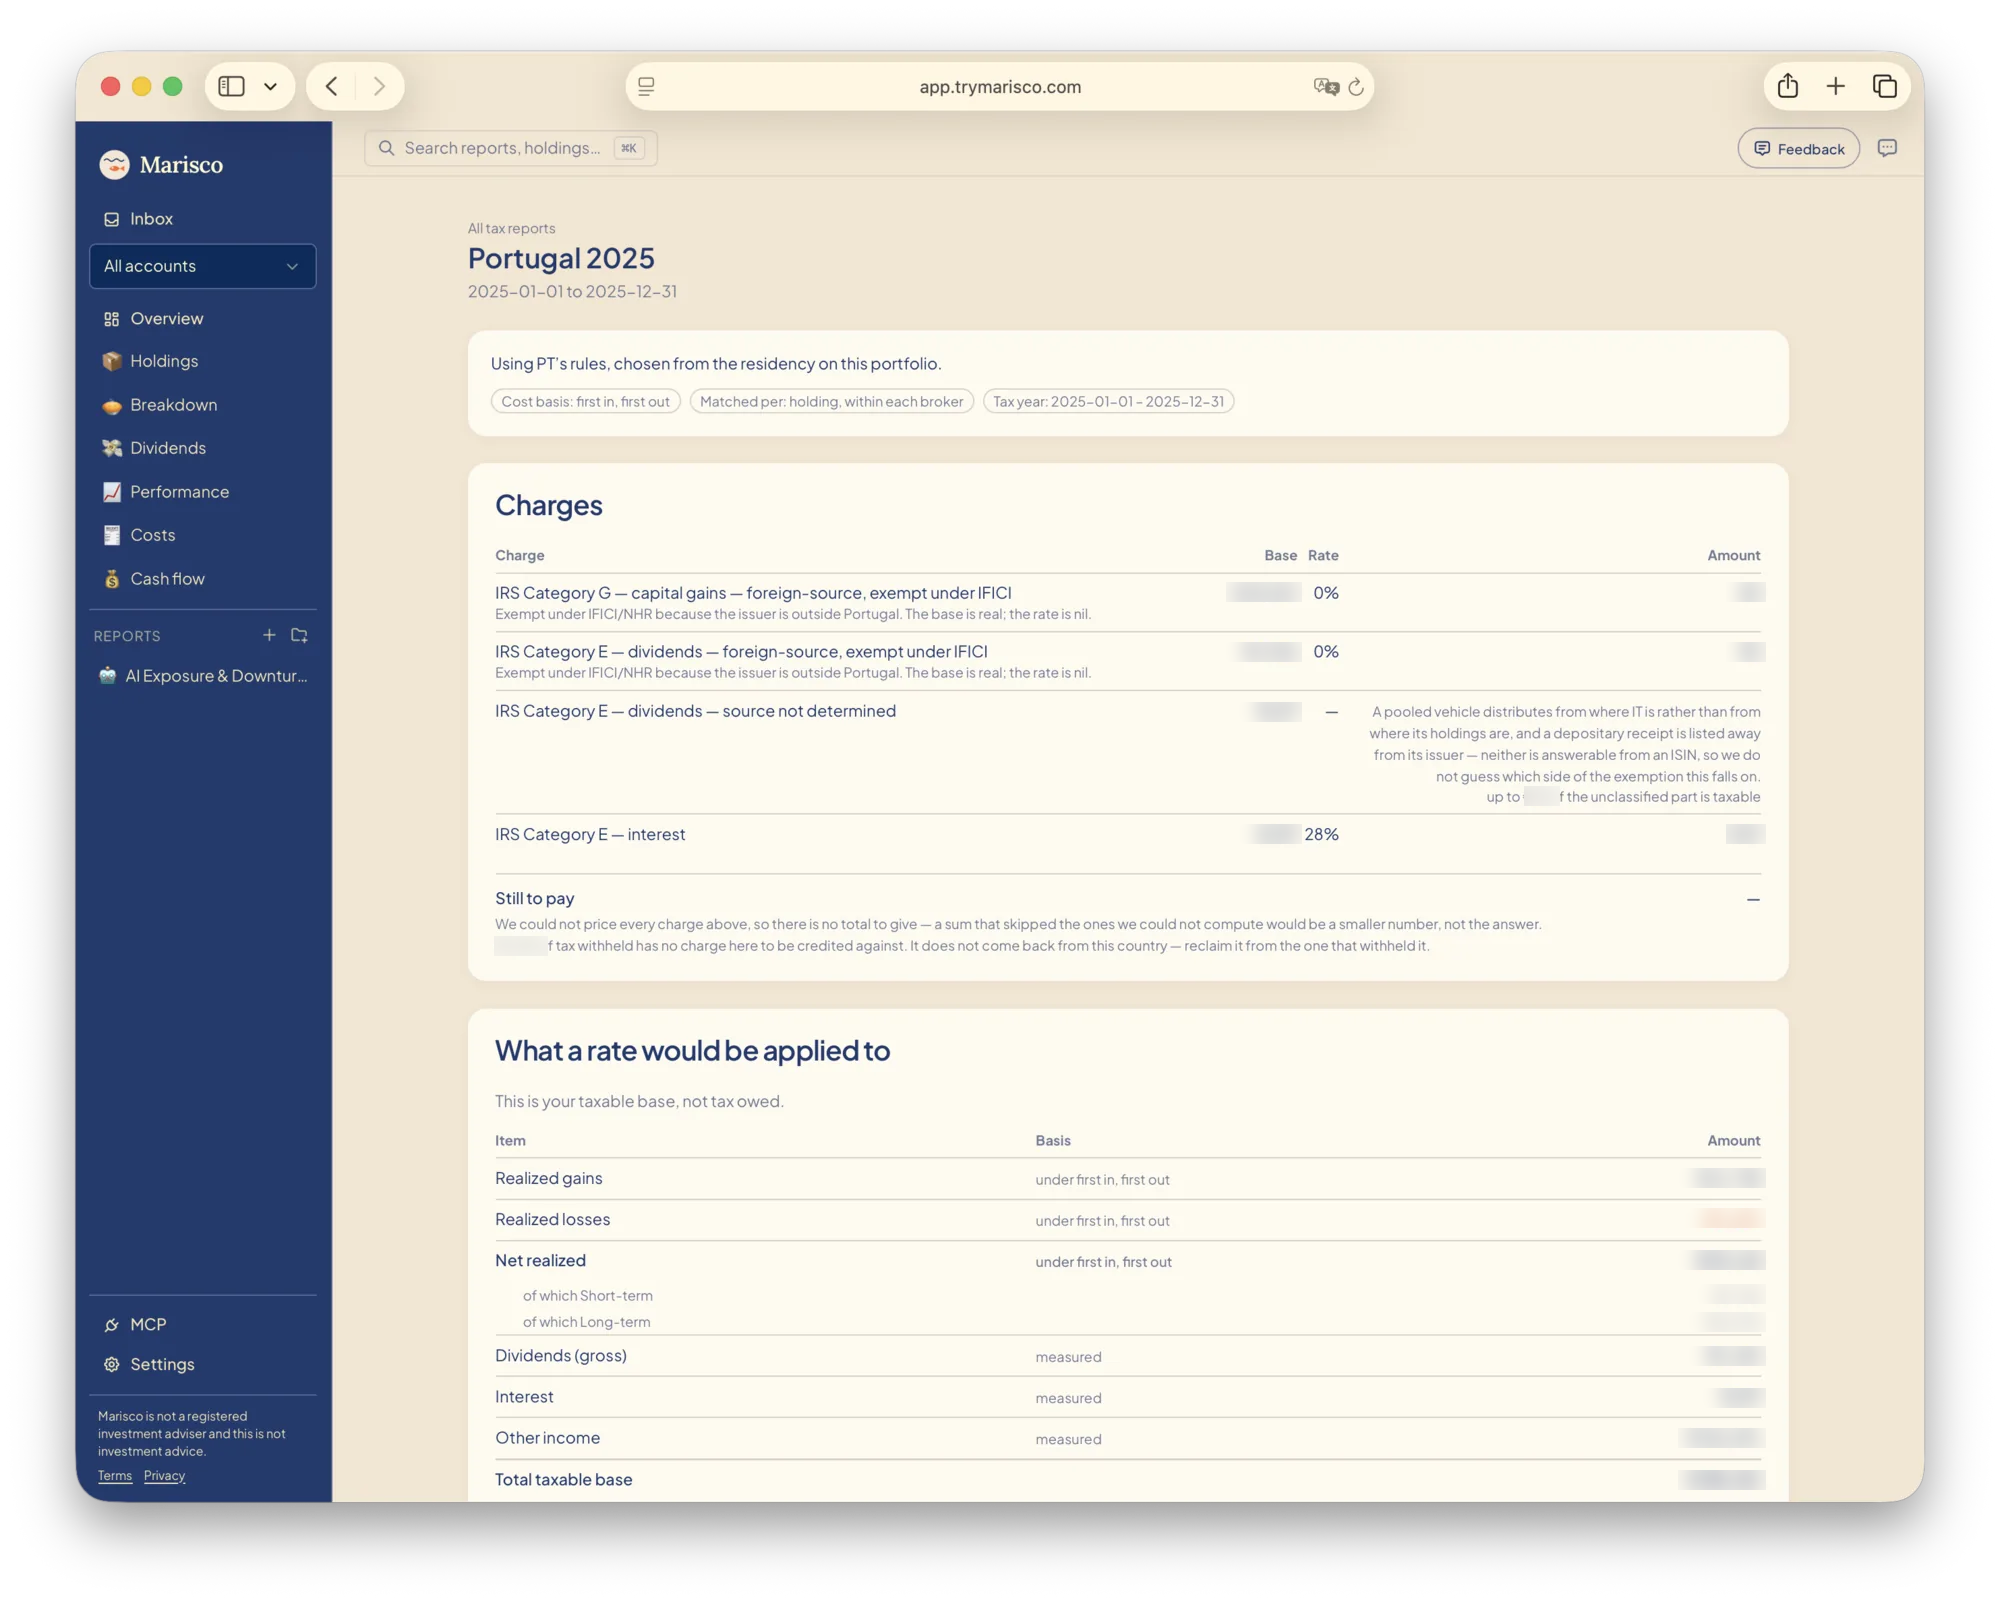
Review realised gains, losses and withheld taxes in one place.
Gains and losses, together
Review the results of investments you sold.
Keep the details close
See withheld taxes alongside your activity.
Return to a tax year
Keep a saved report for each review.
Understand your portfolio. Ask questions in chat. Create personalised reports. Compare your broker fees. Track investing and spending. Explore ideas with scouts.
Understand your portfolioAsk questions in chatCreate personalised reportsCompare your broker feesTrack investing and spendingExplore ideas with scouts
Understand your portfolioAsk questions in chatCreate personalised reportsCompare your broker feesTrack investing and spendingExplore ideas with scouts
Be curious
LEARN
Everything on the screen can selected and be asked about. Click a card, a row or a chart and Marisco explains what it is, why it looks that way, and what to ask next. Follow the thread and your questions become reports you can come back to.
OverviewExample figures
HoldingsExample figures
NameWeightValueGain
DividendsExample figures
PerformanceExample figures
CostsExample figures
Chat
Total value
Is this number my return?
WorkingReading your holdings and cashChecking deposits and withdrawalsSeparating growth from contributions
Not quite. €212,480 is everything you hold across three accounts, cash included. Your investments are up €8,540 this year, but €3,200 of that is money you deposited, so the market did €5,340 of the work.
Dividends
Is €240 a lot?
WorkingReading dividend paymentsComparing previous quartersChecking income against invested value
It is 1.1% of what you have invested, paid mostly by ASML and IWDA. Last quarter was €180, so the income is growing with the positions, not from a change in yield.
Value · 12–19 Mar
What happened here?
WorkingChecking the newsChecking ratiosChecking the marketChecking your portfolio
Mostly the market, not you. Your portfolio fell 6.2% that week and the world index fell 5.4%, so most of it was the sell-off around the Iran crisis: most likely large holders moving into safer assets, with gold up 4% in the same days. ASML and Nvidia fell hardest and have since recovered half of it.
Allocation
Why is so much in single stocks?
Two positions do it. ASML and Palantir are 29% of everything you own, so “single stocks 62%” is mostly them. Whether that is a problem depends on whether you chose it.
Largest holdings
Which holdings did most of the work this year?
WorkingReading each position’s historyComparing historical pricesCalculating contributions to your return
ASML and Nvidia: €3,900 and €2,100 of this year’s €8,540. Palantir gave back €600, and the rest came from IWDA and dividends.
Costs this year
Which broker costs more?
WorkingReading broker feesChecking currency conversionsComparing costs across brokers
DEGIRO €55, Revolut €30. But Revolut’s cost hides in the currency spread, not the fee line: €22 of its €30 came from converting euros to dollars.
ASML
Why is ASML my biggest position?
WorkingReading your ASML tradesChecking historical share pricesComparing cost with current value
You bought it four times since 2023 at an average of €612, and it has risen 42% since. It grew into the top spot more than you bought it there: your purchases add up to €26,900, the position is worth €38,250.
Palantir
What has Palantir done since I bought it?
WorkingFinding your purchase datesChecking Palantir’s price historyComparing each purchase with today
+61% since the first buy in 2024, at an average cost of €74. The lot you added at €120 in March is down 18%, which is why the position feels worse than its number says.
IWDA
Do my ETFs hold these too?
WorkingReading your ETF positionsLooking up fund holdingsFinding overlapping companies
Yes. IWDA holds Nvidia and ASML as well, so your real exposure to those two is about 3 points higher than the rows show. Different funds, some of the same companies.
Nvidia
How much Nvidia do I really own?
WorkingReading your Nvidia positionLooking through your ETF holdingsAdding direct and indirect exposure
7% directly, plus about 1.4% through IWDA, so 8.4% of everything you own. Every 10% move in Nvidia moves your wealth by about €1,800.
Cash
Is this too much cash?
It is 14% of your wealth. €18,000 of it sits in DEGIRO earning nothing, while Revolut pays 3.2% on its share. Whether to hold it is your call; where it sits costs about €45 a month.
By payer
Who pays me the most?
ASML, twice a year, and IWDA, every quarter: together 77% of your income. The rest is Nvidia’s token dividend and interest on cash.
By year
Will I earn more this year?
WorkingReading your income historyChecking the dividend calendarEstimating income from current holdings
On today’s holdings, about €820 for the year: the positions are unchanged, ASML raised its dividend 9%, and IWDA’s payout follows the index. That is a forward yield of 1.2%.
Return vs index
Did I beat the index?
WorkingReading your portfolio historyAdjusting for deposits and withdrawalsComparing with the benchmark
Over the last year, yes: 8.4% against 6.1%, time-weighted, so your deposits do not flatter it. Over three years, no: 21% against 27%. 2024 is the year that cost you, when Palantir was bought near its high.
Worst fall
How bad could it get?
Your worst stretch so far was 11% over five weeks this March, recovered in seven. With 62% in single stocks, a 20% fall is well within the ordinary; the index’s worst in the same period was 9%.
This year, by broker
What am I paying for?
WorkingReading commissions and chargesChecking currency transactionsLooking up fund expense ratios
€47 of trading commissions, €26 of currency spread and €12 of ETF fees, IWDA’s 0.2% a year. The spread is the one that hides: it never appears on a statement, it is inside the exchange rate.
Currency spread
How do I pay less to convert?
WorkingReading your currency conversionsLooking up historical exchange ratesComparing rates on transaction dates
Convert in one lot rather than per trade, and not at the weekend: Revolut’s spread was 0.6% on weekdays and 1.5% on Saturdays, and four of your six conversions were Saturdays. That is €14 of the €26.
Ask about anything on this page…↑
Click anything to take over
Agents working for you
SCOUTS
A scout is a personal researcher that keeps watch for you. It follows your portfolio, a company or a question you care about, checking news and data on a schedule. When there’s something worth knowing, it emails you a report explaining what happened.
New chatScout builder
Follow Nvidia and send me a weekly newsletter on earnings and product news.
Of course. I’ll send you the important updates every Friday.
And if something changes before Friday?
I’ll flag major changes sooner, with links to the sources.
Scout createdNvidia · Every Friday
Message your scout…
Inbox1
Click an email to read it1–4 / 4
Mr.Pulpo <pulpo@trymarisco.com>to you · Just now
Nvidia · Company scout · Your portfolio
Your Nvidia briefing is here
Earnings, product updates, and what to watch next.
Your scout brings the week’s developments together, explains why they matter, and links to the sources so you can explore further.
Your full briefing brings together the evidence, the context for your portfolio, and the questions to explore next.
What changed in the outlook?
Which developments matter over the long term?
What should I keep watching?
Mr.Pulpo
Mr.Pulpo <pulpo@trymarisco.com>to you · Tue
Microsoft · Company scout · Your portfolio
Microsoft: what to watch next
Cloud, AI investment, and the questions worth asking.
Your Microsoft scout connects earnings commentary with product news, with a closer look at cloud growth and AI spending.
Your full briefing brings together the evidence, the context for your portfolio, and the questions to explore next.
What changed in the outlook?
Which developments matter over the long term?
What should I keep watching?
Mr.Pulpo
Mr.Pulpo <pulpo@trymarisco.com>to you · Mon
Weekly perspective · Your portfolio
Your week, in perspective
A portfolio roundup, with the questions worth exploring.
Your weekly scout puts the biggest moves in context, separating company news from wider market changes.
Your full briefing brings together the evidence, the context for your portfolio, and the questions to explore next.
What changed in the outlook?
Which developments matter over the long term?
What should I keep watching?
Mr.Pulpo
Aquarium Residents’ Association <residents@aquarium.example>to you · Sun
We can see you
You can stop tapping. We’ve noticed you.
We appreciate your enthusiasm. However, the glass is not a doorbell, and none of us is expecting a delivery.
Please enjoy the view. We’re doing the same.
The residents
Every Friday
Your week
The moves, earnings and news behind your portfolio’s week, with context beyond the market headlines.
Every weekday
Your biggest holdings
An eye on the positions that matter most to your portfolio, and the events coming their way.
Every Day
Watchlist
How is Nvidia doing? Price changes, news, earning calls. Even social media noise.
Every month
Expenses in check
Notice changes in spending, saving and subscriptions. Useful even if you don’t invest yet.
Be informed
INSIGHTS
Uncover connections, spot concentration, hidden fees and interesting facts about your wealth, so you can keep learning next.
Exposure
61%in two holdings
ASML and Palantir carry most of this portfolio.
Together, these stocks make up 61% of its value. See how the other 39% is spread.
ASML + Palantir61%Everything else39%
Performance
+8.4%time-weighted return
Growth, not just more deposits.
See how your investments performed against a benchmark, separate from the money you added.
Overlap
3 fundswith shared holdings
Different funds. Some of the same companies.
Look through your ETFs to see where the same businesses appear more than once.
3 fundsNvidia2 fundsMicrosoft
Income
€240in dividends this quarter
Your dividends are starting to add up.
See who paid you, when it arrived, and how your income changed over time.
This quarter€240
Last quarter€180
Cash flow
€650invested this month
See where this month’s money went.
You added €650 to investments and spent €1,350 on everyday purchases. Market gains are counted separately.
Added to investments€650
Everyday spending€1,350
Broker fees
€85in fees this year
See what each broker costs you.
Trading and currency-conversion fees can be easy to miss. Compare what you paid across your accounts this year.
DEGIRO€55
Revolut€30
Understand your portfolio. Ask questions in chat. Create personalised reports. Compare your broker fees. Track investing and spending. Explore ideas with scouts.
Understand your portfolioAsk questions in chatCreate personalised reportsCompare your broker feesTrack investing and spendingExplore ideas with scouts
Understand your portfolioAsk questions in chatCreate personalised reportsCompare your broker feesTrack investing and spendingExplore ideas with scouts
TRUST
Secure and private
Your portfolio is personal. Here’s how we look after it.
Encrypted in transit and at rest
Your connection is protected with TLS encryption, and your stored data is encrypted at rest.
Read-only access
Marisco reads your balances and positions. It cannot trade or move your money.
Your logins stay with you
We never see or store your brokerage login credentials. Connections are handled through SnapTrade.
Never sold
We do not sell your personal data. Your portfolio is here to help you understand your investments.
No. Marisco is a portfolio learning and analysis tool. It helps you understand what you own and explore your questions. It does not manage your money or execute trades. You make the decisions.
Which brokers can I use?
You can connect banks and brokers supported by Plaid and SnapTrade, with broad coverage across Europe, the United States and Canada. Availability depends on your institution, country and account type. Select your bank or broker when requesting an invitation so we know what you use.
Can I track several brokers and banks in one place?
Yes. That is the point. Each account you connect lands in one ledger, and Marisco shows the whole picture across all of them: holdings, cash, income and spending, converted into your own base currency. You can still open one account on its own when the question is about that account.
Does Marisco show ETF overlap?
Yes. Marisco looks through your ETFs to the companies inside them, so you can see where the same business turns up in more than one fund, and what your real exposure to it is once your direct holdings are added in. Two funds with different names can still be mostly the same companies.
How is my performance calculated?
Two ways, because they answer different questions. The time-weighted return strips out the money you deposited and withdrew, so it can be compared with an index. The money-weighted return keeps your timing in, so it tells you what your own decisions earned. Marisco shows both and says which is which, so a big deposit is never mistaken for a good year.
A lot more than stock prices. Marisco draws on Financial Modeling Prep (FMP) for market research and EODHD for additional global price coverage. You can explore:
Quotes and prices. Stocks, ETFs, funds, indices, currencies, crypto and commodities, plus trading volumes and price changes.
Historical data. Daily and intraday price histories, including prices adjusted for dividends and stock splits.
Company profiles. Business descriptions, sectors, industries, peers, market capitalisation and shares available to trade.
Financial statements. Income statements, balance sheets, cash flow, quarterly and annual results, and growth trends.
Financial ratios. Valuation multiples, profit margins, returns on capital, debt levels, liquidity and efficiency.
Valuation and financial health. Discounted cash flow estimates, owner earnings, Piotroski scores and Altman Z-scores.
Revenue breakdowns. Where a company makes its money, by product line and geographic region.
Earnings. Reporting dates, reported profits and revenue, analyst estimates, and how results compare with expectations.
Earnings call transcripts. What management said about results, strategy and the questions analysts asked.
Dividends and stock splits. Payment histories, announced dividends, ex-dividend dates and split events.
Market and sector trends. Leading gainers and losers, active stocks, sector performance and industry valuations.
Technical indicators. Moving averages, relative strength, volatility and trend indicators.
Corporate events and filings. IPOs, mergers, acquisitions, SEC filings, delistings and ticker changes.
Index membership and ESG. Current and historical index constituents, plus environmental, social and governance ratings.
News and announcements. Company news, press releases, market headlines and updates on currencies and crypto.
Market schedules. Exchange opening hours, trading holidays and upcoming earnings, dividend and IPO calendars.
Coverage, history and update frequency vary by market and dataset; some prices are delayed. Ask Marisco what you want to investigate, and it can help you make sense of the available data.
A question you can come back to. Ask about your dividends, spending, or biggest positions, and turn the answer into a personalised report with charts and numbers from your own portfolio.
What is a scout?
A job you describe once, in plain language. Try: “Keep an eye on Nvidia and send me a weekly roundup of earnings and product news.” Your scout checks in the background and brings you a personalised newsletter, on your schedule or when there’s something worth knowing.
How much does it cost?
Marisco is free during its private, invitation-only beta. Request an invitation below and we’ll be in touch.
What happens to my portfolio data?
Your portfolio belongs to your account and provides the context for your questions and reports. You can read more about how we handle personal data in our Privacy Policy.
That email address didn’t look right. Please check it and try again.
By requesting an invitation you agree to our Terms and Privacy Policy. Your email is only used for your invitation. No marketing, no spam, never shared.
You’re on the invitation list.
Marisco is opening in small batches while we make every portfolio conversation worthy of your real data. We’ll be in touch.